Image Maps
Summary
Section titled “Summary”An image map is an image with multiple clickable areas. Usually, the clickable areas are links to other pages. For instance, a website featuring a U.S. map with clickable states is an example of an image map. You can click on any state in the map and go to a page with information about that state. To ensure that an image map is accessible, it should include text alternatives for the main image and each clickable area and be easy to use and navigate.
Overview
Section titled “Overview”An image map, defined by the HTML <map> tag, is like a treasure map for your website visitors. It allows you to turn specific areas of an image into clickable areas, directing people to different destinations when they click on those areas.
Image maps are images with clickable areas linking to different destinations or actions, offering an interactive way to present complex information visually, such as geographical maps, flowcharts, infographics, or intricate diagrams. While they can enhance user engagement, they pose significant accessibility challenges, particularly for people with disabilities who rely on screen readers. Like all other images, image maps must have a text alternative; however, unlike other images, a single alt text is not enough to fully explain an image map and each clickable area of the map.
Ensuring accessibility involves:
- providing descriptive alt text for the main image and each clickable area;
- making clickable areas large enough for easy interaction;
- organizing links logically;
- testing for browser compatibility.
By adhering to these best practices, you can create accessible image maps that are inclusive and user-friendly.
Who is Helped
Section titled “Who is Helped”Image maps present information visually. Image maps can, at times, be more intuitive for people, akin to interacting with an object or image in real life, than presenting the information in a text-heavy format. This correlation represents a mental model, an important usability concept that helps people understand web interfaces based on real-world objects and interactions. Image maps may support people with cognitive or learning disabilities by presenting information in a format they are already familiar with. Familiarity can help these individuals understand how to use a new interface.
However, image maps present accessibility challenges for many people, especially people who have low or limited vision or are screen reader users.
Guidelines
Section titled “Guidelines”Requirements for Image Maps
Section titled “Requirements for Image Maps”To ensure that image maps are accessible, they must contain text alternatives for the main image, each clickable area, and be easy to navigate logically. The Web Content Accessibility Guidelines (WCAG) states that — like all non-text content — image maps must have text alternatives to ensure that an equivalent experience is available for people with disabilities and to support WCAG Success Criteria 1.1.1:
For non-text content that is a control or accepts user input, such as images used as submit buttons, image maps or complex animations, a name is provided to describe the purpose of the non-text content so that the person at least knows what the non-text content is and why it is there.
Best Practices for Using Image Maps
Section titled “Best Practices for Using Image Maps”- Provide Alternative Text Links: Always provide alternative text links alongside image maps, especially for navigation. This practice ensures accessibility for people with disabilities and search engine optimization.
- Consider Accessibility: Before using an image map, carefully consider its accessibility implications. Ensure it doesn’t hinder usability for people with disabilities or other accessibility needs.
Creating Image Maps
Section titled “Creating Image Maps”To create an image map, follow these steps:
- To create an image map, you first define a
<map>element with a name attribute, like<map name="examplemap">, and associate it with an<img>element using theusemapattribute. Inside the<map>element, you then define the clickable areas using<area>elements. These areas can be different shapes: rectangular, circular, or polygonal. - For each shape, you specify coordinates using the
coordsattribute. For example, for a rectangular area, you’d provide the coordinates of the top-left and bottom-right corners, likecoords="0,0,300,42". Similarly, for a circular area, you’d give the center coordinates and the radius, such ascoords="130,136,60". Polygons require specifying the coordinates of all edges, likecoords="x1,y1,x2,y2,...,xn,yn". These coordinates are in CSS pixels and determine the size, shape, and placement of each clickable area.
Here is an example of a simple, but not yet accessible, image map:
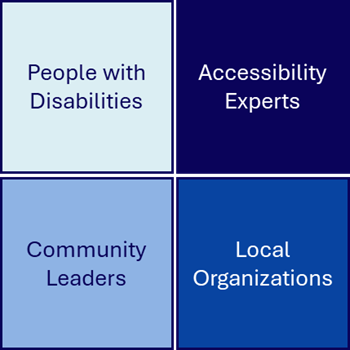
<img src="connecting.png" usemap="#map1" ><map id="map1" name="map1"> <area shape="rect" coords="0,0,50,50" href="pwd.html"> <area shape="rect" coords="50,0,100,50" href="experts.html"> <area shape="rect" coords="0,50,50,100" href="orgs.html"> <area shape="rect" coords="50,50,100,100" href="leaders.html"></map>Alternatively, an image map generator can streamline the process for creating image maps.
Ensuring Accessibility of Image Maps
Section titled “Ensuring Accessibility of Image Maps”It is important to ensure that image maps are accessible. A screen reader user, for example, would not be able to identify the embedded links unless descriptive alt text is provided for each linked clickable area.
To ensure the accessibility of your image maps, follow these guidelines:
- Provide Alt Text for the
<img>element: This text should offer a concise description of the content or function of the image. A text alternative is necessary on the<img>element itself to convey the context of the image. This guidance supports WCAG technique H24: Providing text alternatives for the area elements of image maps.- For complex images, standard alt text (a short phrase or sentence) may not be sufficient to explain the image. For more information on how to provide alternatives for complex images, see Complex Images.
- Provide Alt Text for each
<area>element: This text should offer concise descriptions of the content or function of the clickable areas. Text alternatives are necessary on each of the<area>elements to convey the link destination or resulting action if the link is followed. This guidance also supports WCAG technique H24: Providing text alternatives for the area elements of image maps. - Make Large Clickable Areas: Expand the clickable area to cover the entire linked shape. It’s acceptable to make the clickable area slightly larger than the shape itself to ensure ease of use. At a minimum, the clickable area should be 24x24 pixels in size unless you also provide redundant text links. See Target Size for more information on sizing clickable areas. When an area in an image map is very small, use a direct label to connect the target area to a larger clickable area. For example, a U.S. map might have a line connecting the small state of Delaware to linked text of the state’s name.
- Order Links Properly: Arrange the links in the image map in a logical order, typically from left to right and top to bottom. This arrangement aids people who navigate using the keyboard.
- Watch File Size: Be mindful of the file size of your image maps, particularly if they are large or if you have multiple maps on a page. Large image maps can slow down page loading times, especially on mobile devices.
- Use Client-Side Image Maps: Client-side image maps should always be used over server-side ones for better accessibility, unless there is no alternative to using a server-side image map. A best practice for server-side maps is to include a separate text-based menu for accessibility compliance, but these can be very difficult to make accessible.
- Check Browser Compatibility: Browser implementation for image maps can vary, so test your maps across different browsers and devices. Ensure each image map is used only once and that the
<map>element is a direct sibling to the image (it is placed directly after the image in the code).
<img src="connecting.png" usemap="#map1" alt="Connecting people to create more inclusive communities. Select an area to learn how we empower each group of people within a community.">
<map id="map1" name="map1">  <area shape="rect" coords="0,0,50,50" href="pwd.html" alt="People with disabilities">  <area shape="rect" coords="50,0,100,50" href="experts.html" alt="Accessibility experts">  <area shape="rect" coords="0,50,50,100" href="orgs.html" alt="Local organizations">  <area shape="rect" coords="50,50,100,100" href="leaders.html" alt="Community leaders"></map>
By adhering to these guidelines, you can create image maps that are accessible to a wide range of people, including those with disabilities, and improve the overall usability and performance of your website.
Pros and Cons of Using Image Maps
Section titled “Pros and Cons of Using Image Maps”Image maps may be a convenient way to convey information on your website, but there are drawbacks. Here are some pros and cons of using image maps.
Pros of Using Image Maps:
- Visual Presentation: Image maps excel at conveying complex information visually, making them ideal for displaying maps and other graphical data representations. This functionality is an example of redundant cueing, which can support people with cognitive and learning disabilities, by supporting the text links with visual images through an image map.
- Interactivity: They enhance user engagement by providing interactive elements within images, allowing people to explore and interact with specific areas.
- Familiarity: Image maps may appear as a familiar object or image to people, providing a more intuitive experience.
Cons of Using Image Maps:
- Accessibility Challenges: Image maps pose significant accessibility challenges, especially for people with disabilities. Screen readers may struggle to interpret image maps.
- Search Engine Optimization: Search engine indexing of links within image maps is less effective.
- Complexity for Navigation: Using image maps for navigation is strongly discouraged due to usability issues. They are less intuitive than standard text links, potentially leading to confusion and frustration for people. Image maps are best used to supplement content, not to replace it.
- Page Load Times: Image maps can contribute to slower page load times, particularly if the image is large and complex. This time lag can impact user experience, especially on slower connections or mobile devices.
- Difficulty in Building and Maintaining: Building image maps can be time-consuming and complex, especially compared to traditional hyperlinking methods. Specialized tools or editors may be required, adding to the development process. Image maps can also be challenging for developers to maintain.
- Decreased Popularity: Image maps are not as popular as they once were, potentially making them appear outdated or less aligned with current web design trends.
- Creates Clutter: Image maps can lead to cluttered designs when overdone. This clutter can lead to confusion instead of clarifying concepts for people.
When to Avoid Using Image Maps:
- Navigation: Avoid using image maps for navigation purposes, as they can be challenging for people to navigate effectively, especially those with disabilities.
- Server-Side Image Maps: Server-side image maps present accessibility challenges and should be avoided whenever possible. Convert them to client-side image maps for improved accessibility.
Here is an example of an image map from the National Weather Service.
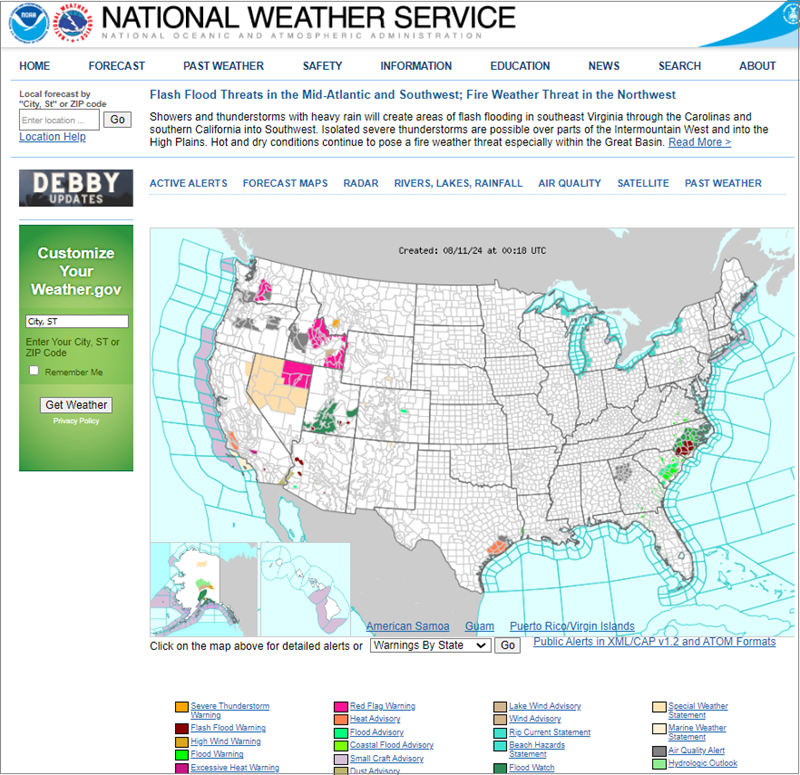
This map provides several ways to access information:
- a person can click the map,
- use the dropdown menu to select a state or county, or
- use the search function to search for a particular area.
The map would be painful for a keyboard navigator or screen reader user to use without these text-based alternatives, so the search and dropdown options provide good alternatives.
In summary, while image maps can be useful for presenting visual information and adding interactivity, their accessibility challenges and potential usability issues, particularly for navigation, should be carefully weighed before implementation. Always prioritize accessibility and usability when designing web content.
How to Test
Section titled “How to Test”To ensure that an image map is accessible and meets WCAG standards, make sure that you implement the following guidelines. Use a visual inspection of the page in combination with your browser’s “Inspect” tool or an accessibility test tool like the ARC Toolkit to:
- Check the alternative text for the
<img>element and each<area>element. This text should offer concise descriptions of the content or function of the linked areas. - As a best practice, provide redundant text links for each active region in the image map.
- Ensure that you arrange image map links in a logical order, typically from left to right.
- Check to make sure that the clickable area covers the entire linked shape and is at least 24x24 pixels in size unless you also provide redundant text links.
- Ensure that you only use an image map once. If you use multiple images with the same map, you should duplicate the map and have different IDs.
ARC Toolkit (Ta11y) is a good choice for these checks. It reports missing alt text errors for the image map and the map regions. Tools like WAVE and ANDI do not reliably find both of these errors.
This image shows the test results using the ARC Toolkit. There is an error for an <area> tag that is missing alt text.
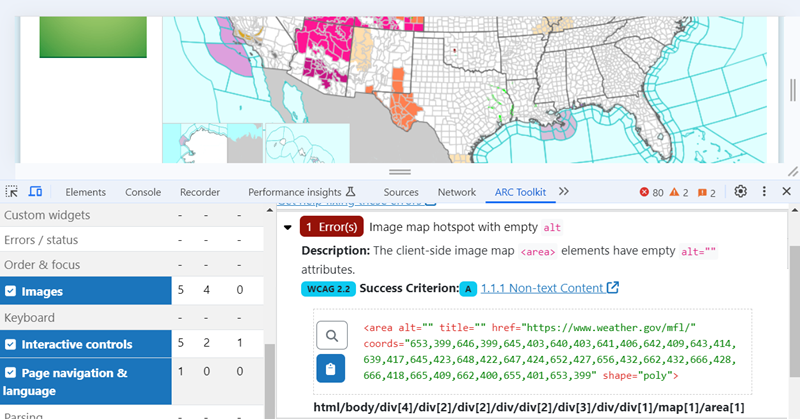
<area> ErrorThis second image highlights the missing alt text for the image map.
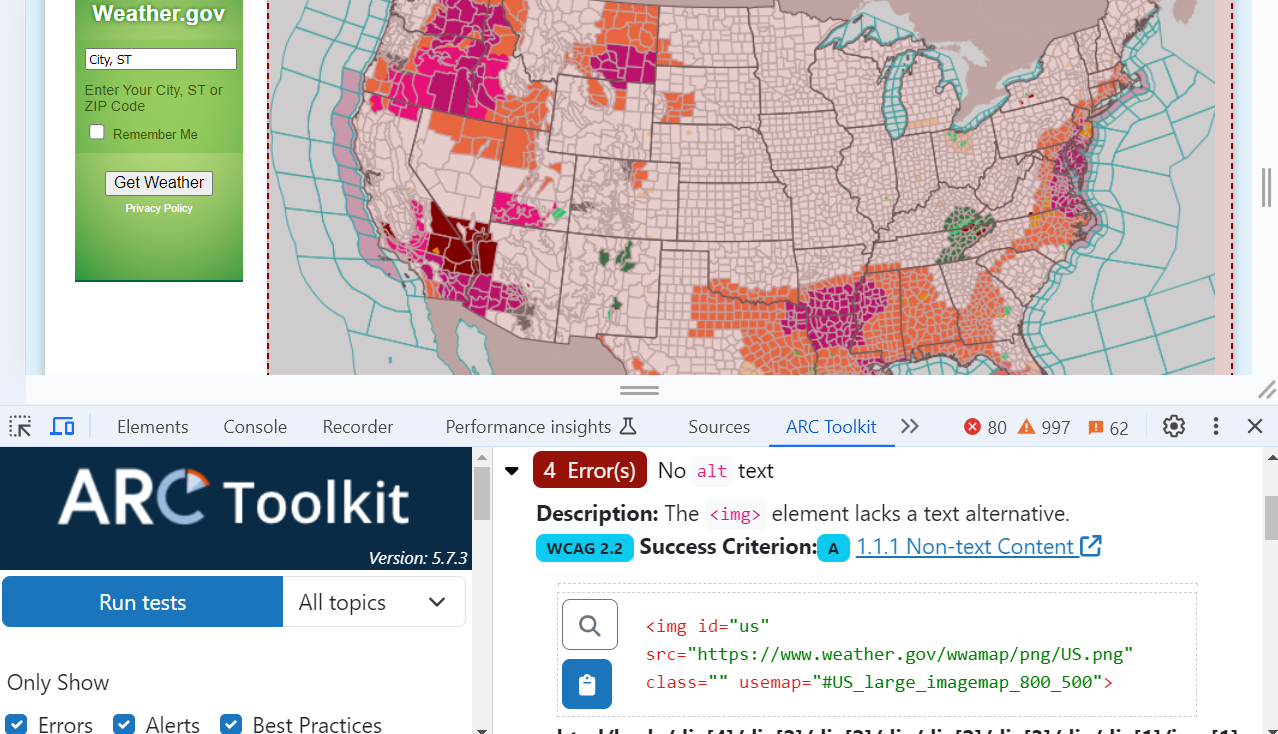
<img> ErrorReferences
Section titled “References”- WCAG Success Criteria 1.1.1 - Non-Text Content
- WCAG Technique H24: Providing text alternatives for the area elements of image maps
- Web Accessibility Initiative (WAI) Tutorial - Image Maps
- Mozilla Developer Network - The Image Map element
- Mozilla Developer Network -
<area>: The Image Map Area element - W3Schools - HTML Image Maps
- W3Schools - HTML
<map>tag - Level Access - Image Maps
- Accessibility at Penn State - Image Maps in HTML
- Code it Pretty: What You Should Know About Image Maps
- Nielsen Norman Group - Mental Models